Test Drive
Gating Setup
Depending on the sample type, user-defined gates can be set to either Enabled or Disabled by selecting the Gating setup screen in the Home screen.
Test Drive
Select Your Sample
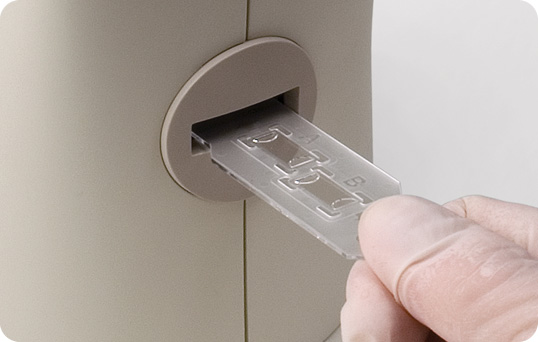
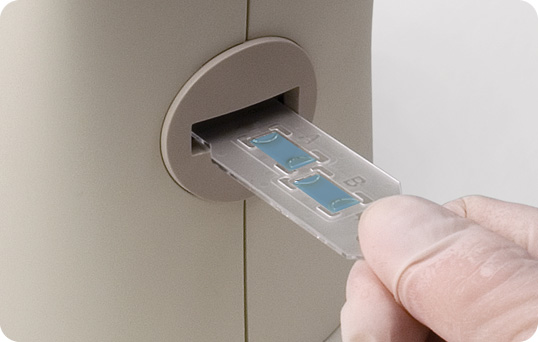
Click an orange dot to select the sample you want to count. Sample A is a cell suspension — total cell count/ml will be analyzed. Sample B is a cell suspension stained with trypan blue (1:1) — total and live cell count/ml will be determined.
Home
- Count cells
- Current count
- Gating setup
- Previous counts
- Export data
- Options
Gating setup
Current count
Current count
Current count
Dilution calculator
Current count

Current count

Current count

Current count

Pre-Count Histogram
- Total
Post-Count Histogram
- Total
Post-Count Histogram
- Total

Post-Count Histogram
- Live
- Dead
Post-Count Histogram
- Live
- Dead

Use this option to start a count or recount an already inserted slide.
Use this option to return directly to the screen with the current count result.
Use this option for viewing results from up to 100 previous counts stored in the instrument. Results are organized by date and time stamps, with the most recent count displayed first.
With this option, results from 100 previous counts and an image of cells can be downloaded to a USB flash drive immediately after the count.
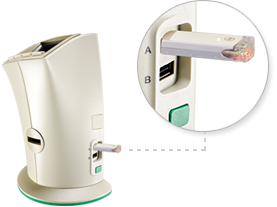
The Options screen contains the following choices:
-
[] Autosave/sample name
For setting up the automatic export of cell images to a USB flash drive and for setting up sample naming preferences. The exported image (JPEG format) has a metatag containing all of the cell count data and can then be further analyzed using the TC20 data analyzer software. -
[] System test
For verifying the performance of the instrument; a verification slide is needed for this function. The verification slide is a printed glass slide with a defined number of circles printed on each side of the slide. -
[] Set date/time
For setting the date and time on the instrument. Results are associated with date and time stamps. -
[] Update firmware
For upgrading the firmware. -
[] Delete all counts
For deleting all counts stored in the instrument.
Immortal cell lines (or other samples composed of cells with similar cell size):
User-defined gates can be Disabled. The cell counting algorithm then automatically identifies the cell population of interest without requiring user input.
Samples with multiple cell populations (e.g., stem cells and other primary cells):
User-defined gates must be Enabled. Once enabled, a histogram is displayed at the beginning of each cell count and the user can select the population of interest by adjusting the position of the cell size gates.
When this option is enabled by selecting Yes, the TC20 will save the positions of cell size gates and apply them to subsequent counts, thus making the counting of sample replicates easier. When this option is disabled by selecting No, the cell size gates will be placed where the TC20 presumes the population of interest appears in the histogram.
If the image preview is set to On, an image of cells will be displayed during gating in the histogram screen. In the image, only cells with diameters between the cell size gates will be marked with a yellow dot.
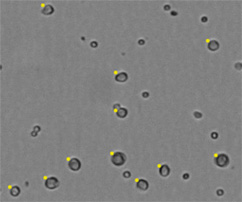
The TC20 automated cell counter uses microscopy with auto-focus that analyzes multiple focal planes to identify the best plane. Without requiring any user input, the sophisticated cell counting algorithm uses the image acquired from the best focal plane to identify cells and exclude debris, thereby calculating the total cell count. The auto-focus leads to highly reproducible cell counts with reduced user-to-user variability compared to a hemocytometer and cell counters with manual focus.
When user-defined gates are enabled, a histogram is displayed prior to the cell count. Use this “pre-count” histogram to select the population of interest in a sample containing multiple cell populations. This histogram offers a quick look at the makeup of the sample because it is shown before the counting analysis takes place. Once you select the population of interest by adjusting the cell size gates, the actual total count (and live/dead analysis if trypan blue is present) occurs. Objects within the selected size range (delineated by the position of the cell size gates) are analyzed; those with diameters outside of that size range are excluded from the cell count.
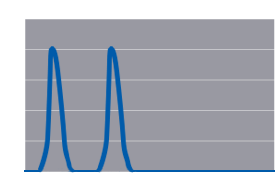
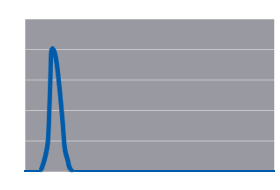
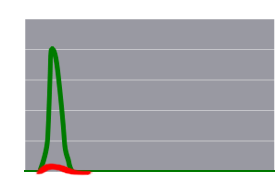
A "post-count" histogram can be viewed after the cell count is completed, as one of the analysis options from the Current count screen. This histogram shows the size distribution from the completed cell count and includes only cells within the size range delineated by the position of gates on the pre-count histogram. For samples without trypan blue, the plot shows the total cell count. For samples with trypan blue, two plots are used to show the number of live and dead cells.
The arrows are used to set the low gate at the desired position.
The arrows are then used to set the high gate at the desired position.
A histogram of cell size distribution, displayed after the cell count is completed, shows the approximate cell diameters (in µm) on the x-axis and the cell counts on the y-axis. Only cells that were included in the cell count screen are shown. If a population was excluded by adjusting cell size gates prior to the cell count (via enabled user-defined gates), then it is not shown.
The arrows are used to set the low gate at the desired position.
The arrows are then used to set the high gate at the desired position.
With the Export image option, a flash drive can be used to save the current count. Metatags containing all count data are attached to the image file.

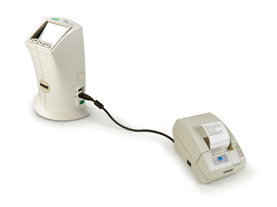
With the Print count option, a thermal label printer can be connected to the TC20 cell counter to print results.
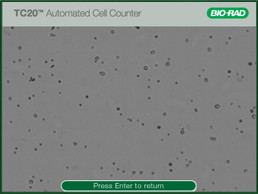
With this option, an image of cells can be viewed onscreen and downloaded to a USB flash drive immediately after the count.
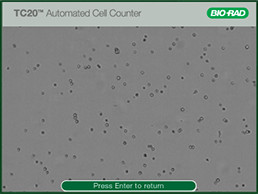
With this option, an image of cells can be viewed onscreen and downloaded to a USB flash drive immediately after the count.
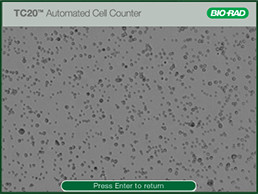
With this option, an image of cells can be viewed onscreen and downloaded to a USB flash drive immediately after the count.
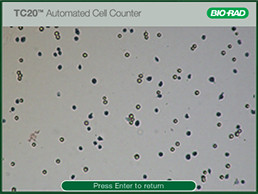
With this option, an image of cells can be viewed onscreen and downloaded to a USB flash drive immediately after the count.
The dilution calculator is used to calculate volume adjustments needed to achieve the cell concentration required for the next experiment. If trypan blue was used during the count, the instrument accounts for the 1:1 dilution with the dye in the calculation results, and only the live cell concentration will be used for calculations. To use it, click the up or down arrow key to select a value, then press Enter to confirm the selection. If the value of the desired cell count is higher than the starting cell count, "Invalid dilution" will display on the screen.
